Spotlight DQ
ih_spotlight_dq is a dbt package for healthcare data quality monitoring and reconciliation. It evaluates completeness, terminology validity, and enrollment-to-claims alignment across your data sources, then publishes PHI-safe aggregate summaries your team can use for scorecards, trend analysis, and stakeholder reporting.
The package runs on any dbt-supported adapter, including Snowflake, Databricks, BigQuery, Redshift, Spark, and Fabric.
What it does
Spotlight DQ produces three categories of output:
Reconciliation
Month-level metrics that verify enrollment and claims data align. For each combination of data_source, payer, plan, and month:
- Member months and unique members
- Total claims and claim lines
- Paid amounts (with and without enrollment matching)
- Derived rates: claims per 1,000, PMPM paid, percent of members with claims, average paid per claim
These metrics let you answer: "Do our claims totals make sense relative to who was enrolled each month?"
Completeness
Field-level null/non-null analysis across input-layer tables (eligibility, medical claims, pharmacy claims). For each field:
- Total rows, applicable rows, null rows, non-null rows
- Percentage breakdowns
Some fields have applicability rules. For example, DRG codes are only applicable to institutional claims, so professional claims are excluded from the denominator rather than counted as missing.
Terminology validation
Field-level validation against reference terminology tables and business rules. For each field:
- Everything from completeness checks, plus:
- Valid rows (value exists in the reference table or passes the validation rule)
- Invalid rows (non-null value that fails validation)
- Valid percentage of applicable rows
This catches issues like invalid diagnosis codes, unrecognized NPIs, out-of-range dates, and malformed identifiers.
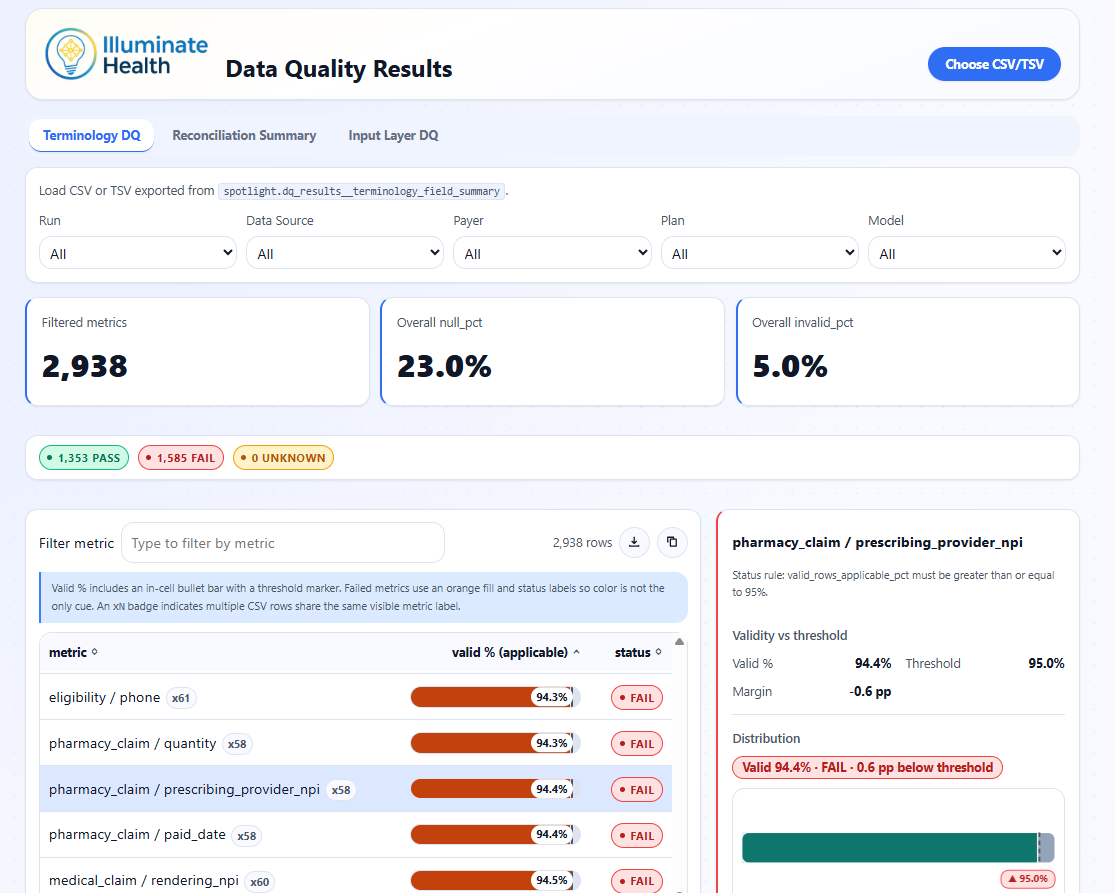
Data Quality Results Viewer showing terminology validation pass rates, threshold status, and per-metric validity distributions.
Official-run history
By default, the package builds current-run summaries only. When you set dq_persist_results: true, it also appends results to incremental history tables with a run_id and run_ts stamp.
Over time, this builds a time series of DQ metrics across production runs. Convenience views expose the latest and previous official runs for easy delta comparison.
See Official Runs and History for details.
Design principles
- PHI-safe: all outputs are aggregate counts and percentages. No row-level or patient-level data is published.
- No seeds or custom config: the package reads from upstream Tuva-style models and terminology tables. No seed files to manage.
- Multi-adapter: shared SQL with adapter-aware incremental strategies (merge on most adapters, delete+insert on Fabric and others).
- Tuva-native: designed to sit downstream of The Tuva Project core models and reference data.