Outputs And Dashboard
CMS TEAM Analyzer publishes dbt marts for executive reporting, operational reviews, and drill-down analysis. The Streamlit dashboard reads these marts directly.
Core Marts
| Mart | What it answers |
|---|---|
mart_team__episode | What happened in each episode, what it cost, what target was used, and whether the episode was favorable |
mart_team__overview | How the organization is performing overall and by bundle |
mart_team__performance_period | How performance changes by month during the performance period |
mart_team__driver_rollup | Which surgeons, sites, partners, discharge patterns, or bundles are driving variance |
mart_team__care_pathway | How post-acute pathways and discharge destinations affect spend and readmissions |
mart_team__opportunity | Which drivers and open episodes should be reviewed first |
mart_team__episode_component | How each episode's spend breaks down by service component |
mart_team__post_episode_monitoring | What happens in days 31-60 after the TEAM episode window |
mart_team__reconciliation_snapshot | A reconciliation-style snapshot for internal monitoring |
Reporting marts other than mart_team__episode are scoped to the configured
performance period, so the overview, driver, pathway, and opportunity tables all
describe the same population. mart_team__episode keeps baseline years available
for retrospective analysis.
Executive Dashboard
The dashboard ships with the package and runs out of the box against the published marts. It is organized around common management questions.
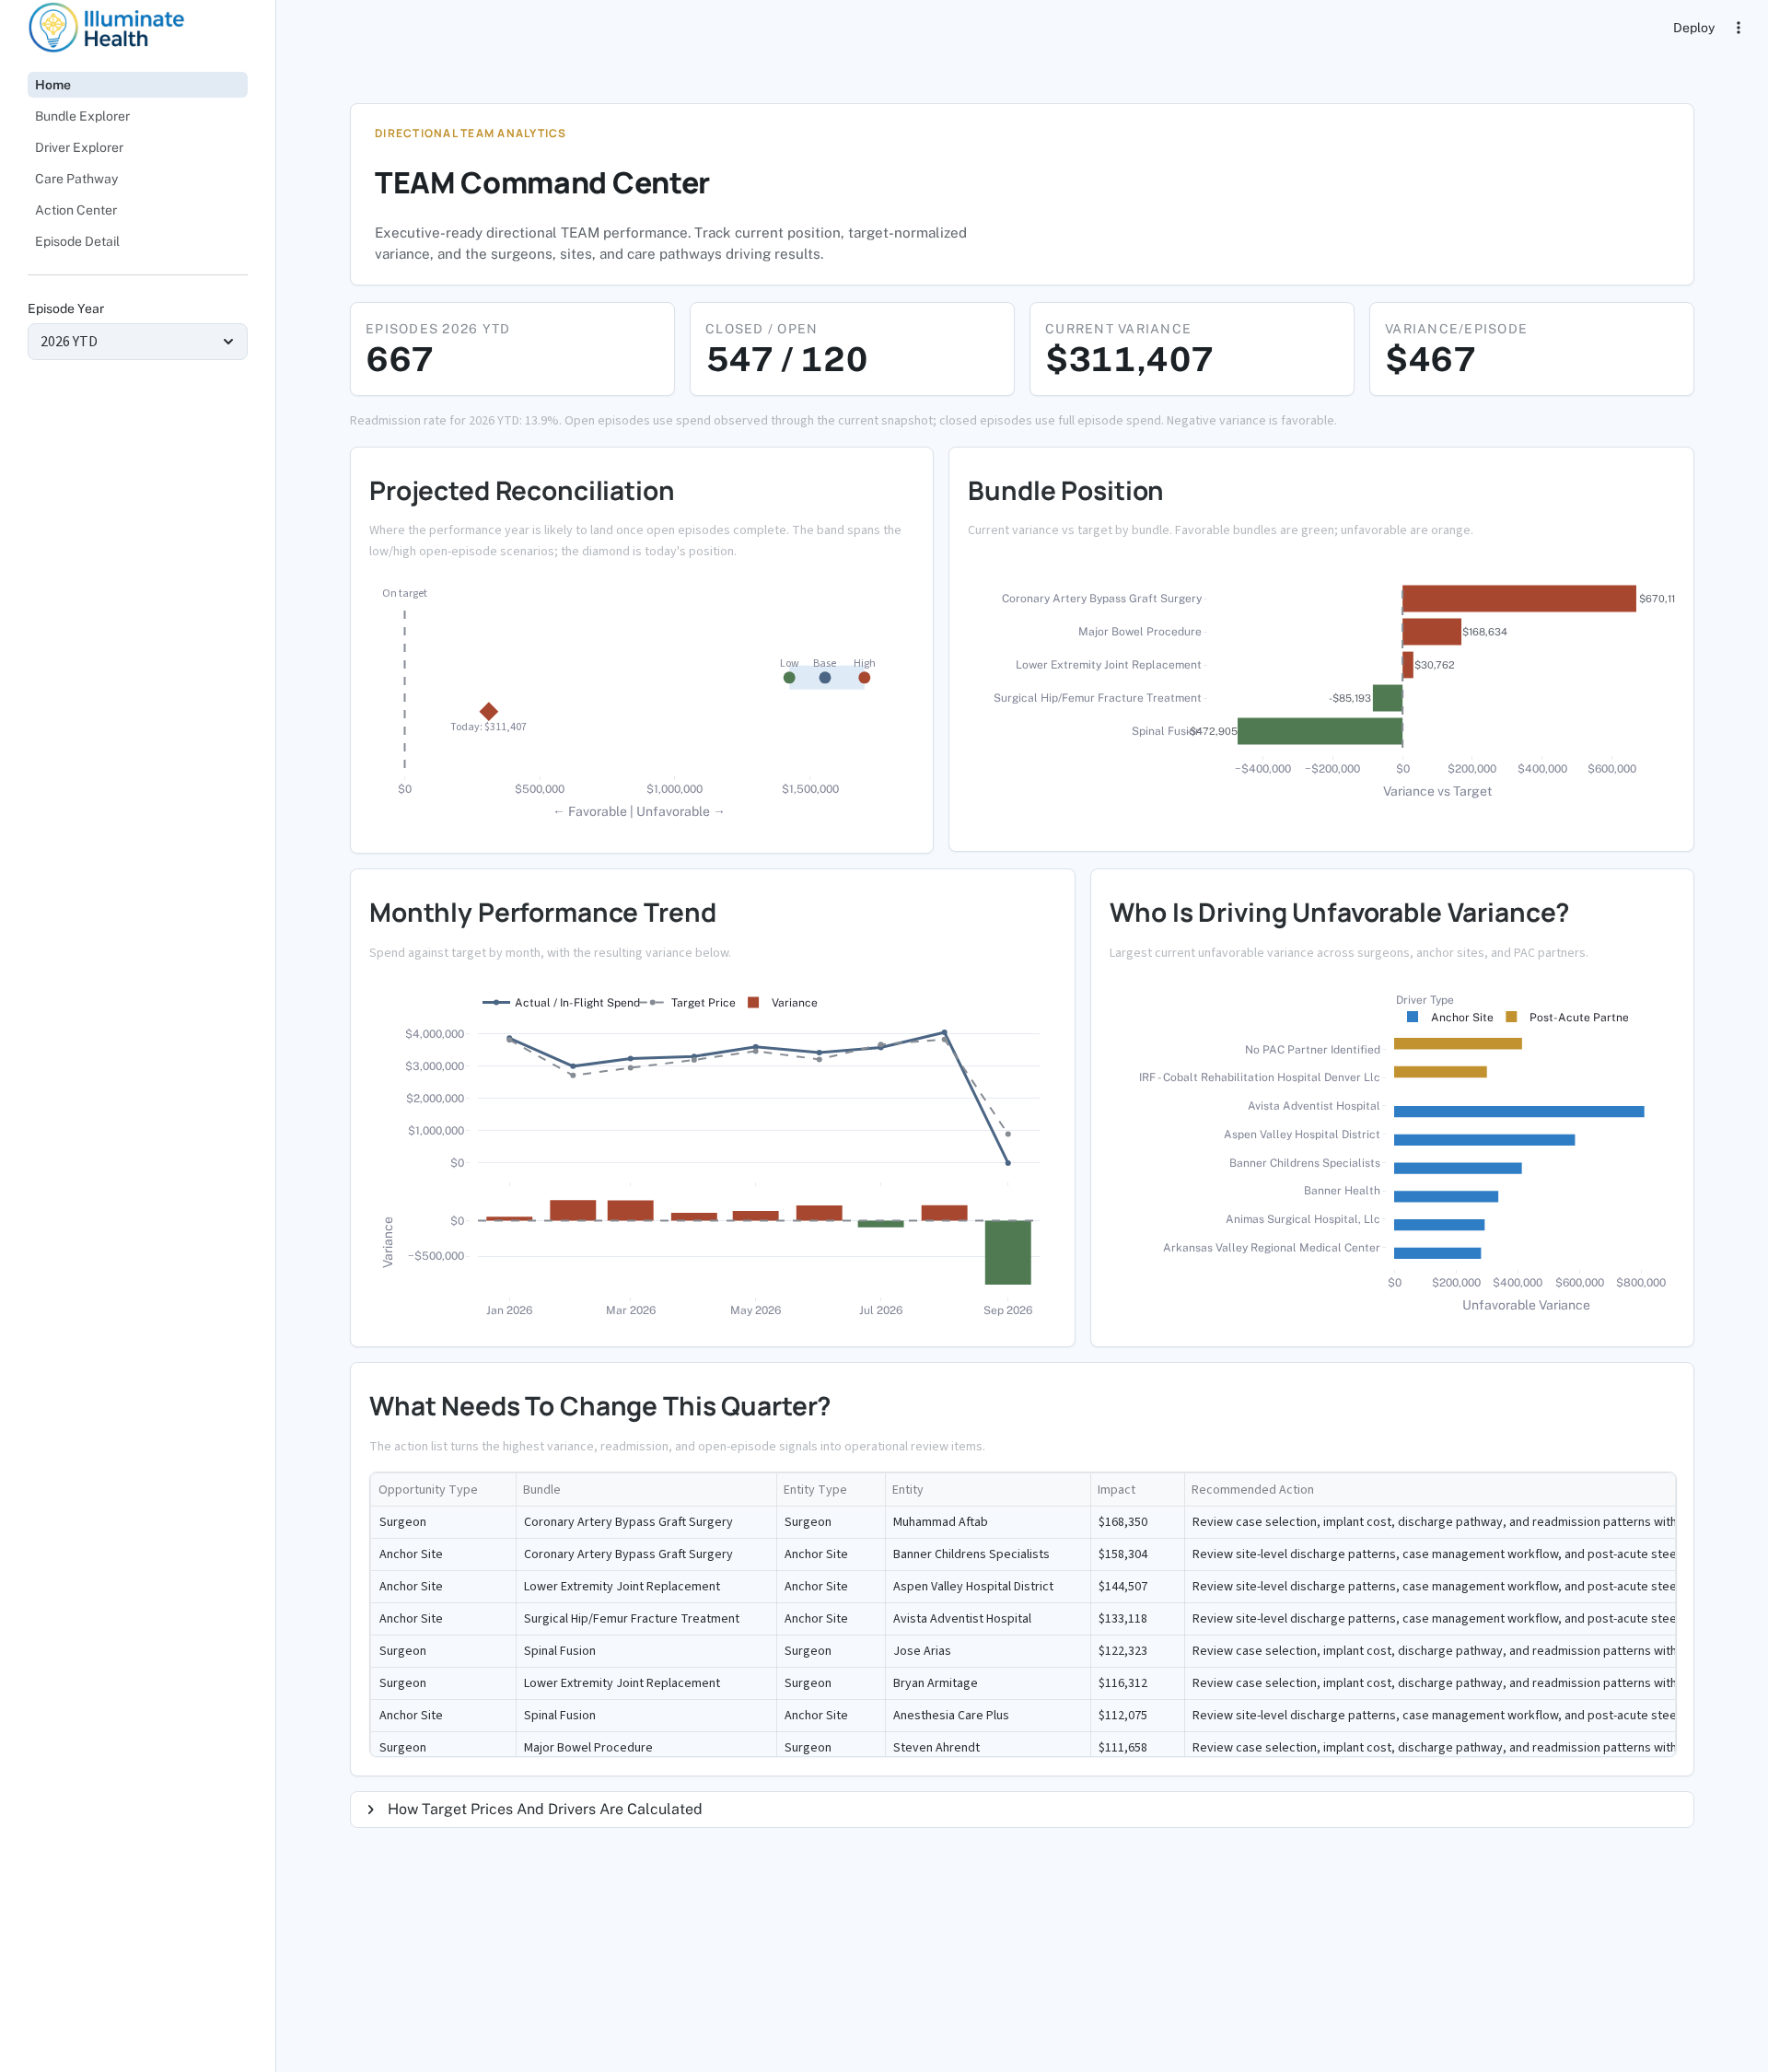
TEAM Command Center
The home page answers "where do we stand?" — episode volume, current variance, the projected reconciliation range for the in-flight year, bundle position, monthly spend against target, and the drivers contributing the most unfavorable variance.
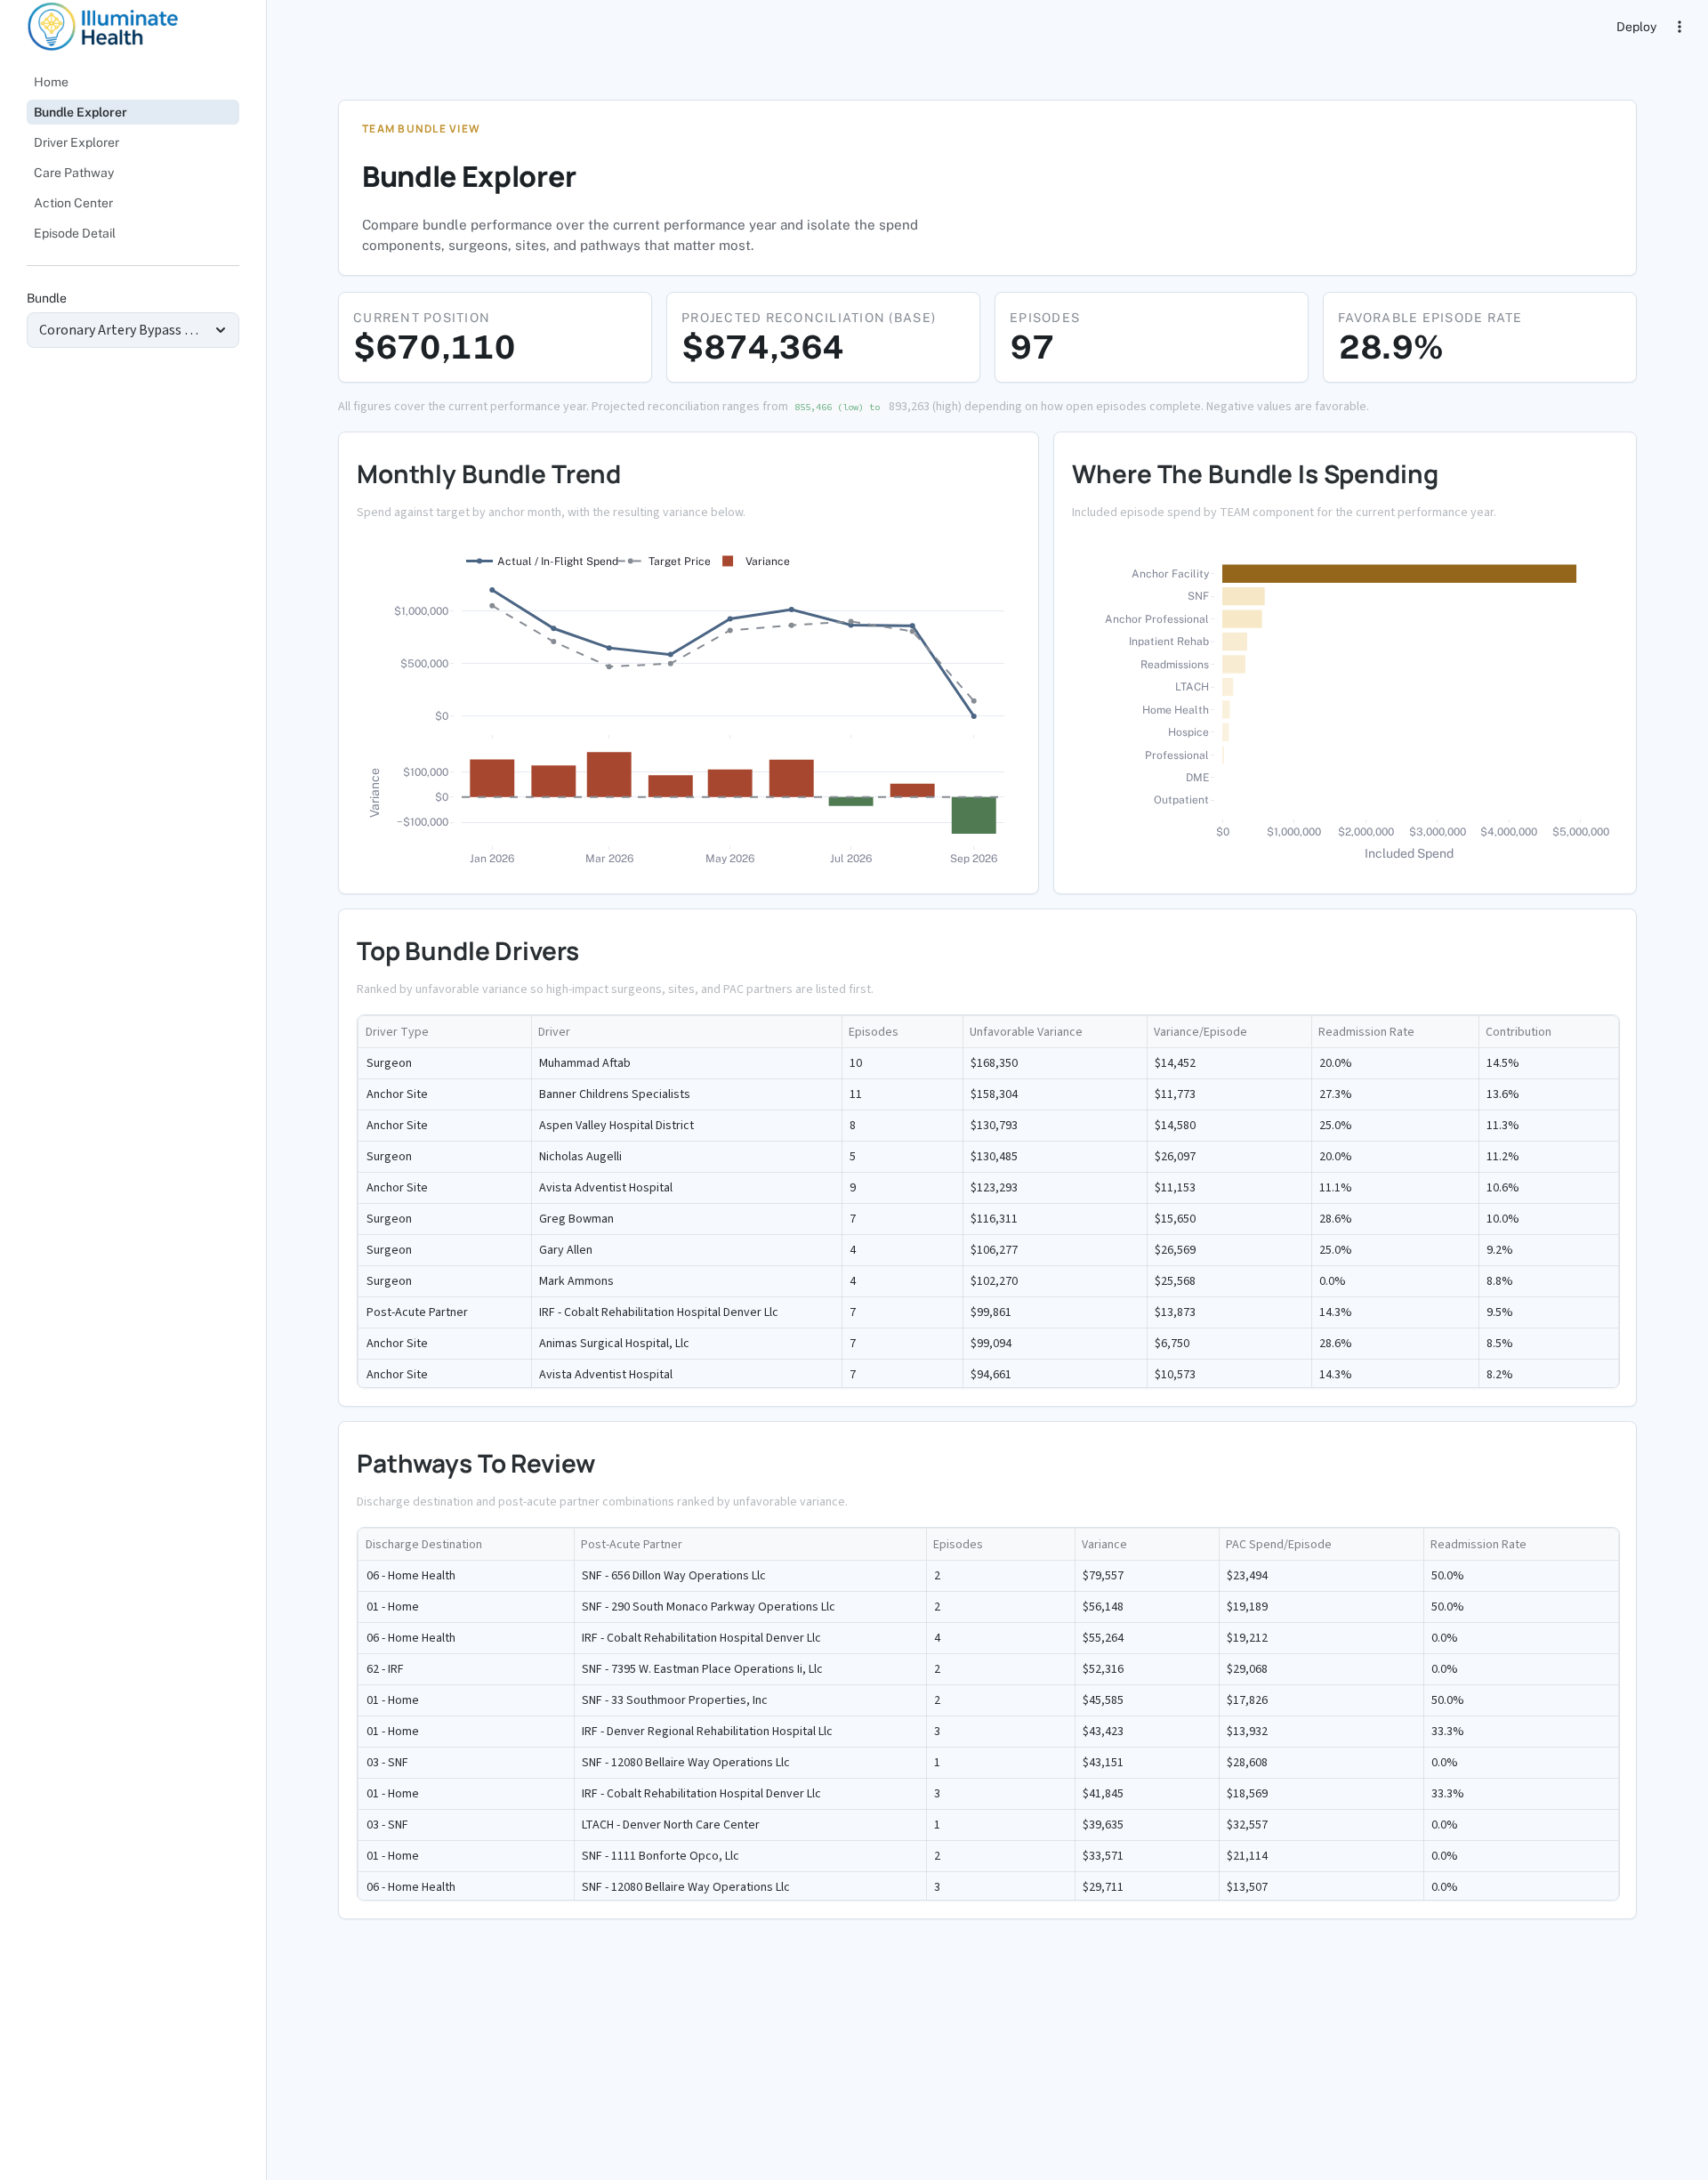
Bundle Explorer
Per-bundle performance for the current performance year: monthly spend-vs-target trend with variance bars, included spend by TEAM component, and the ranked surgeons, sites, partners, and pathways behind the numbers.
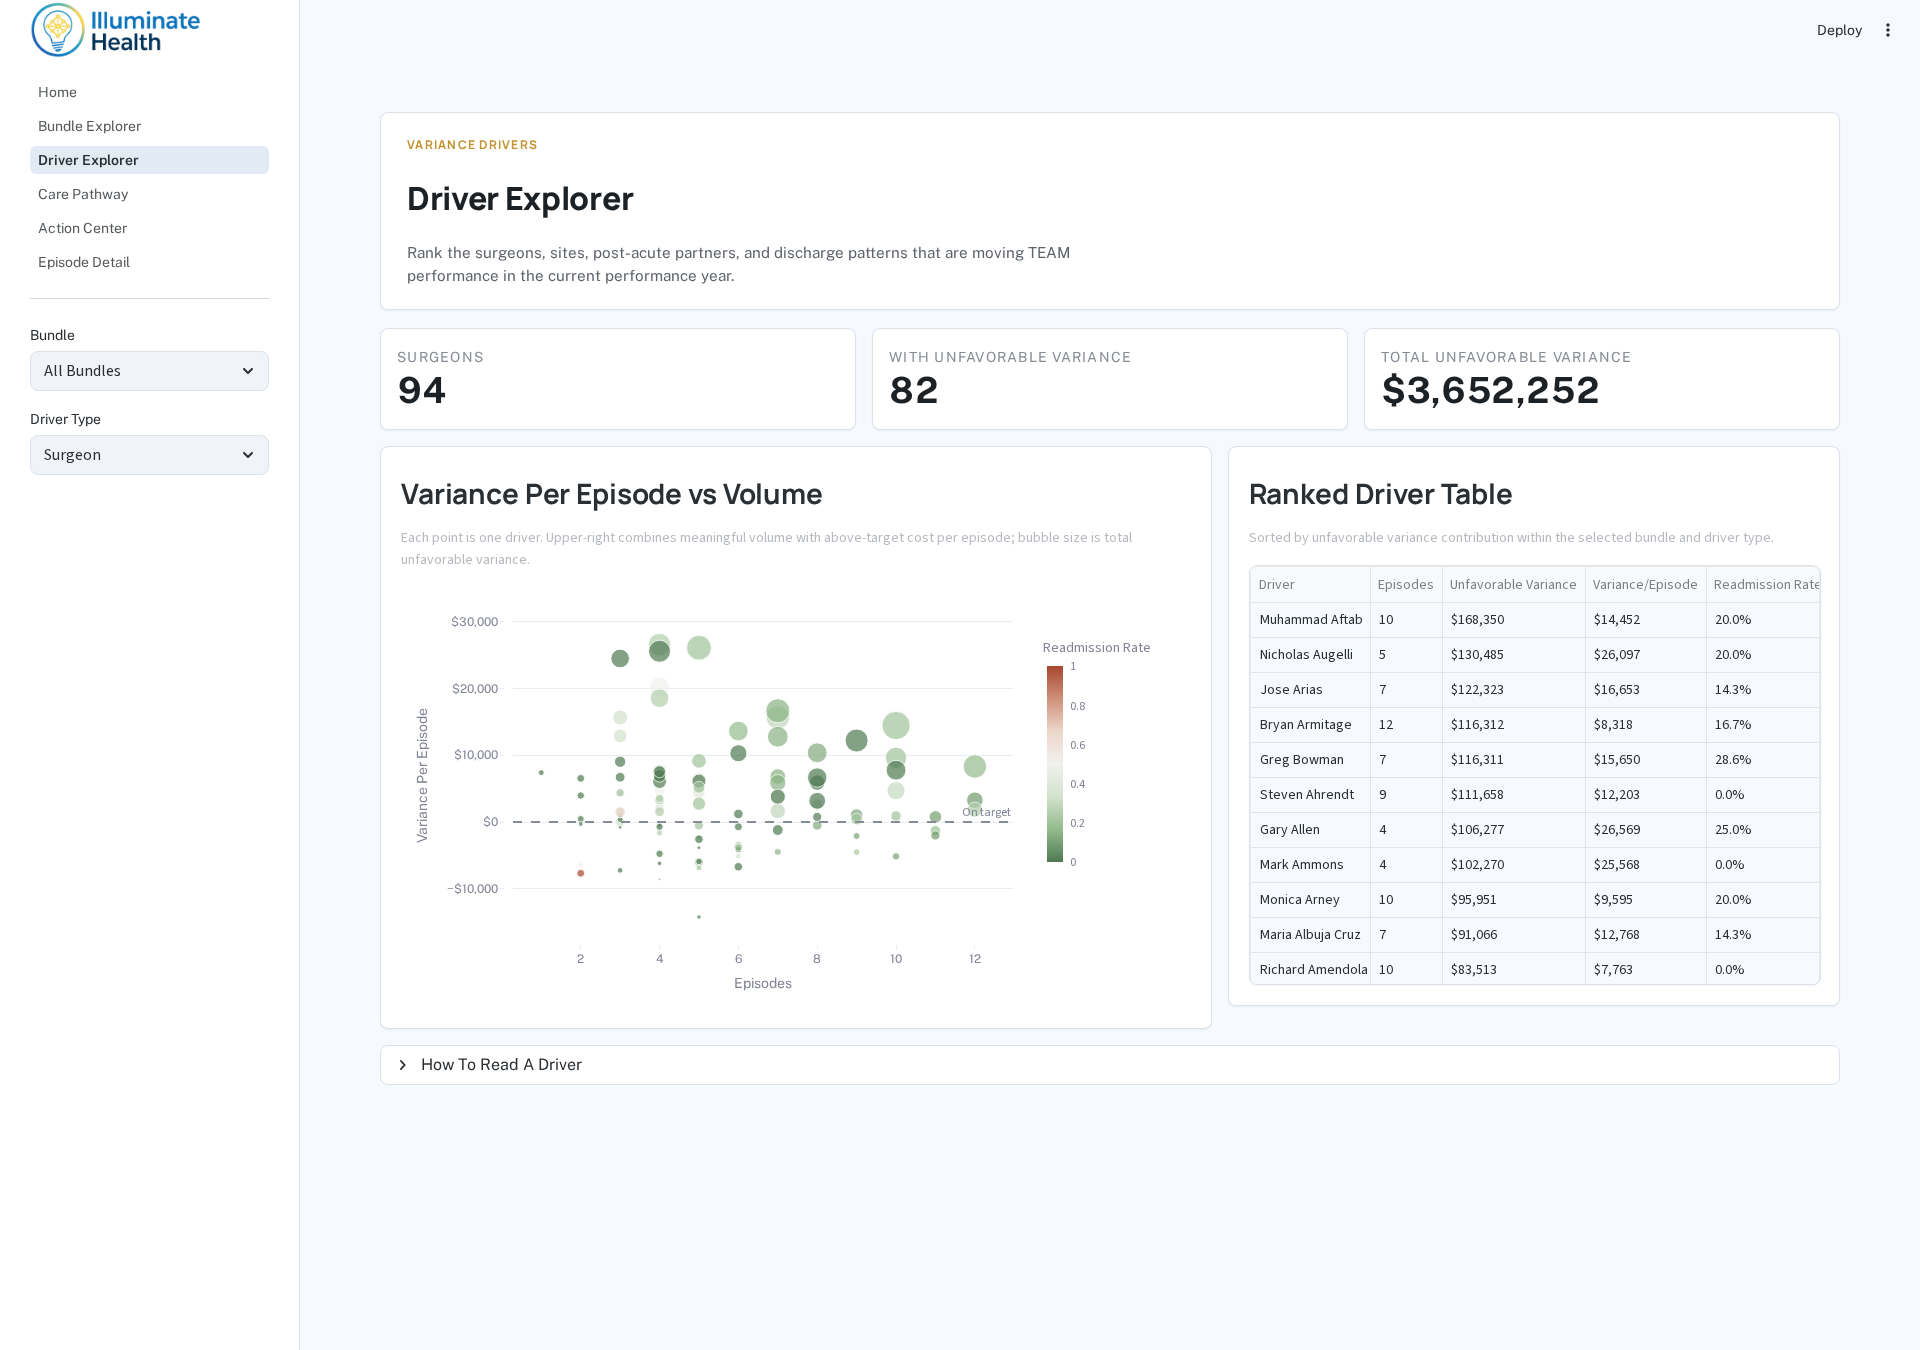
Driver Explorer
Variance-per-episode against volume for every surgeon, anchor site, post-acute partner, or discharge destination, with a ranked table of unfavorable variance contribution.
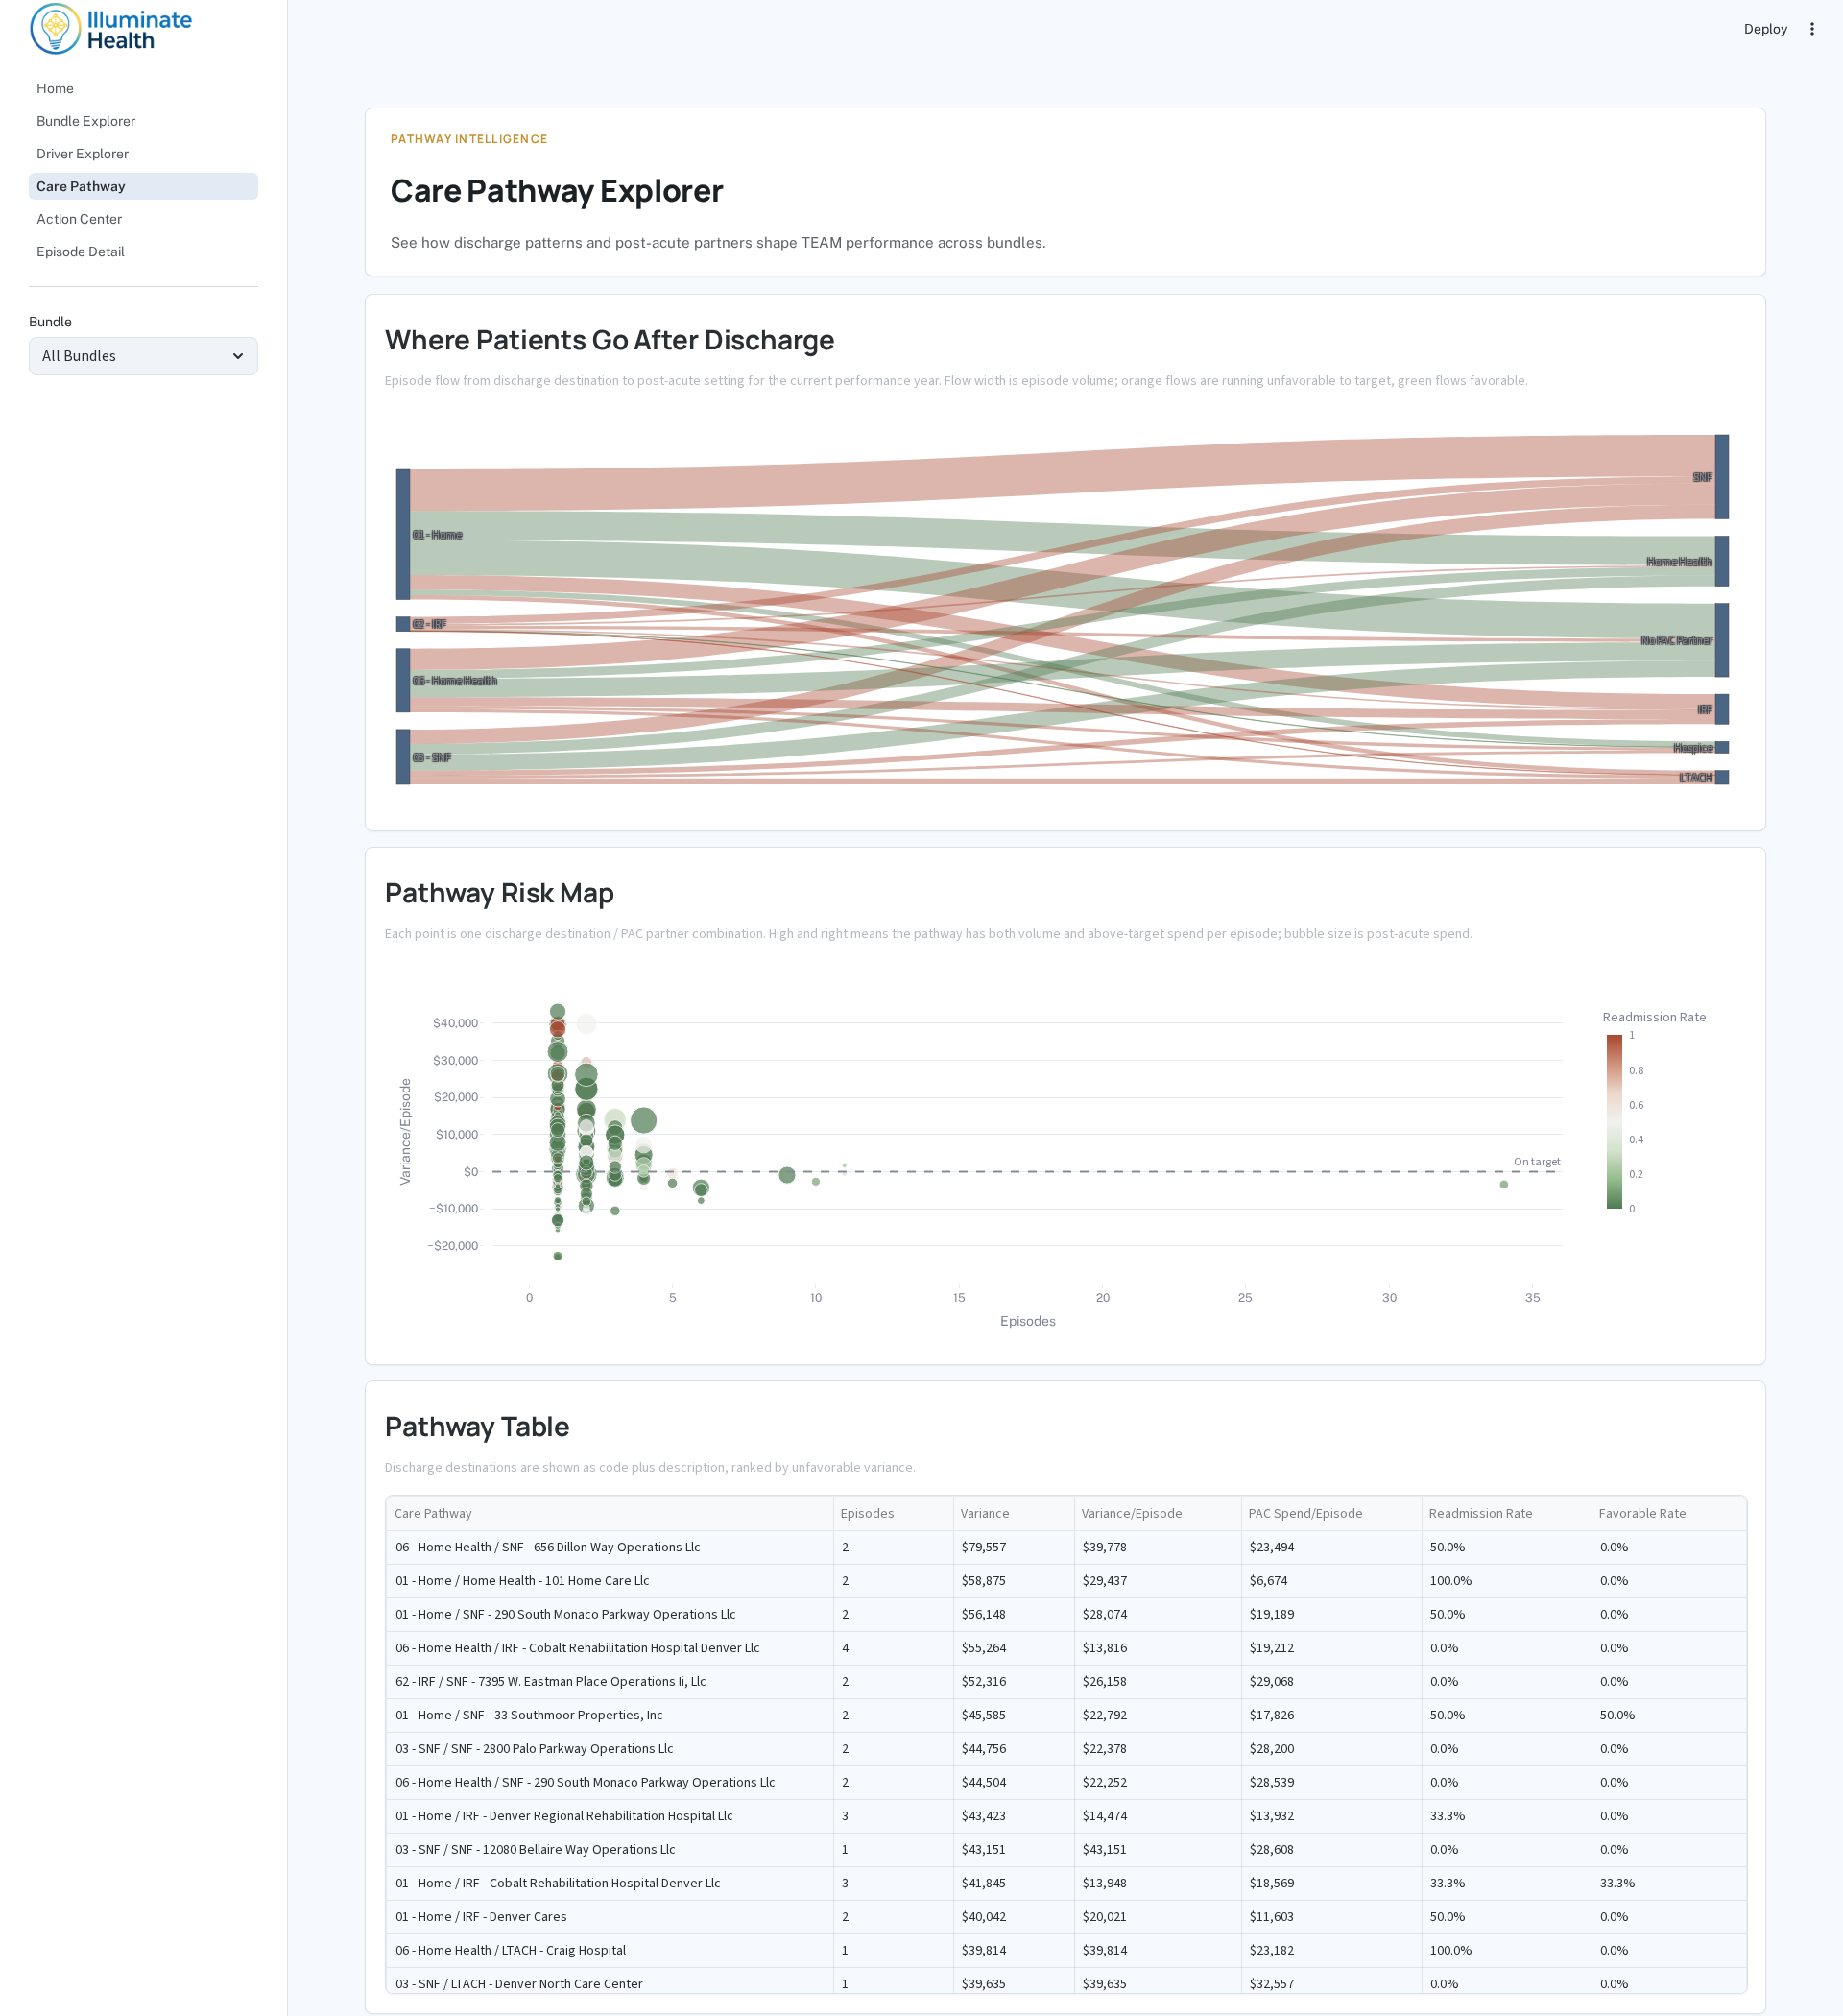
Care Pathway
Episode flow from discharge destination to post-acute setting, a pathway risk map, and a ranked pathway table. Orange flows are running unfavorable to target; green flows favorable.
Action Center
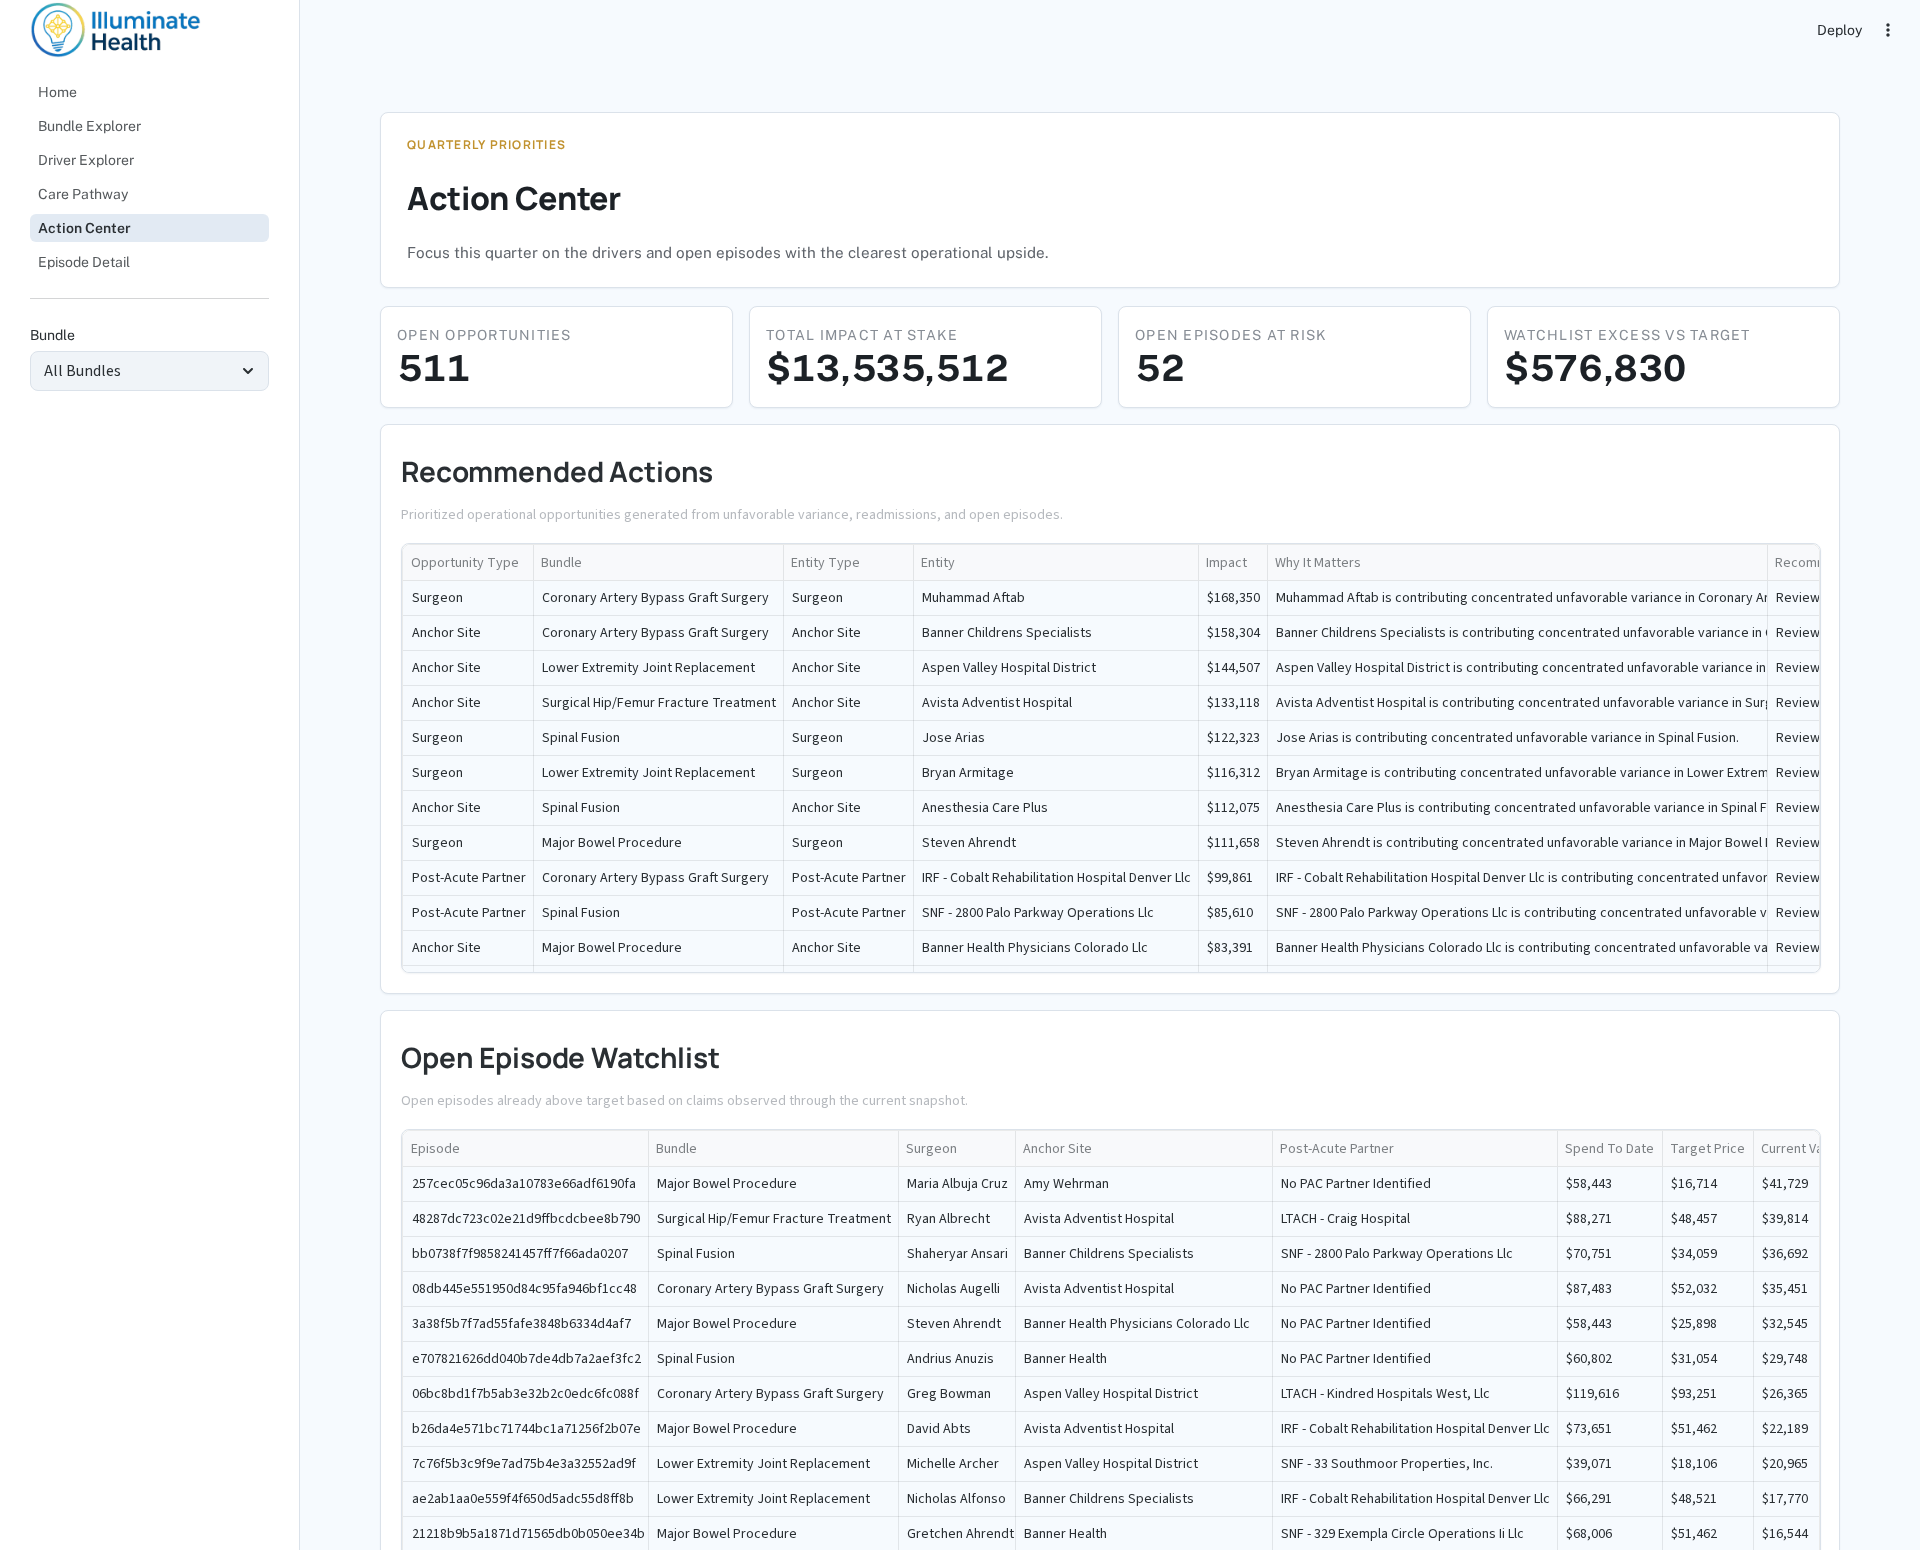
The opportunity worklist and open-episode watchlist with impact totals, prioritized for quarterly operational review.
Episode Detail
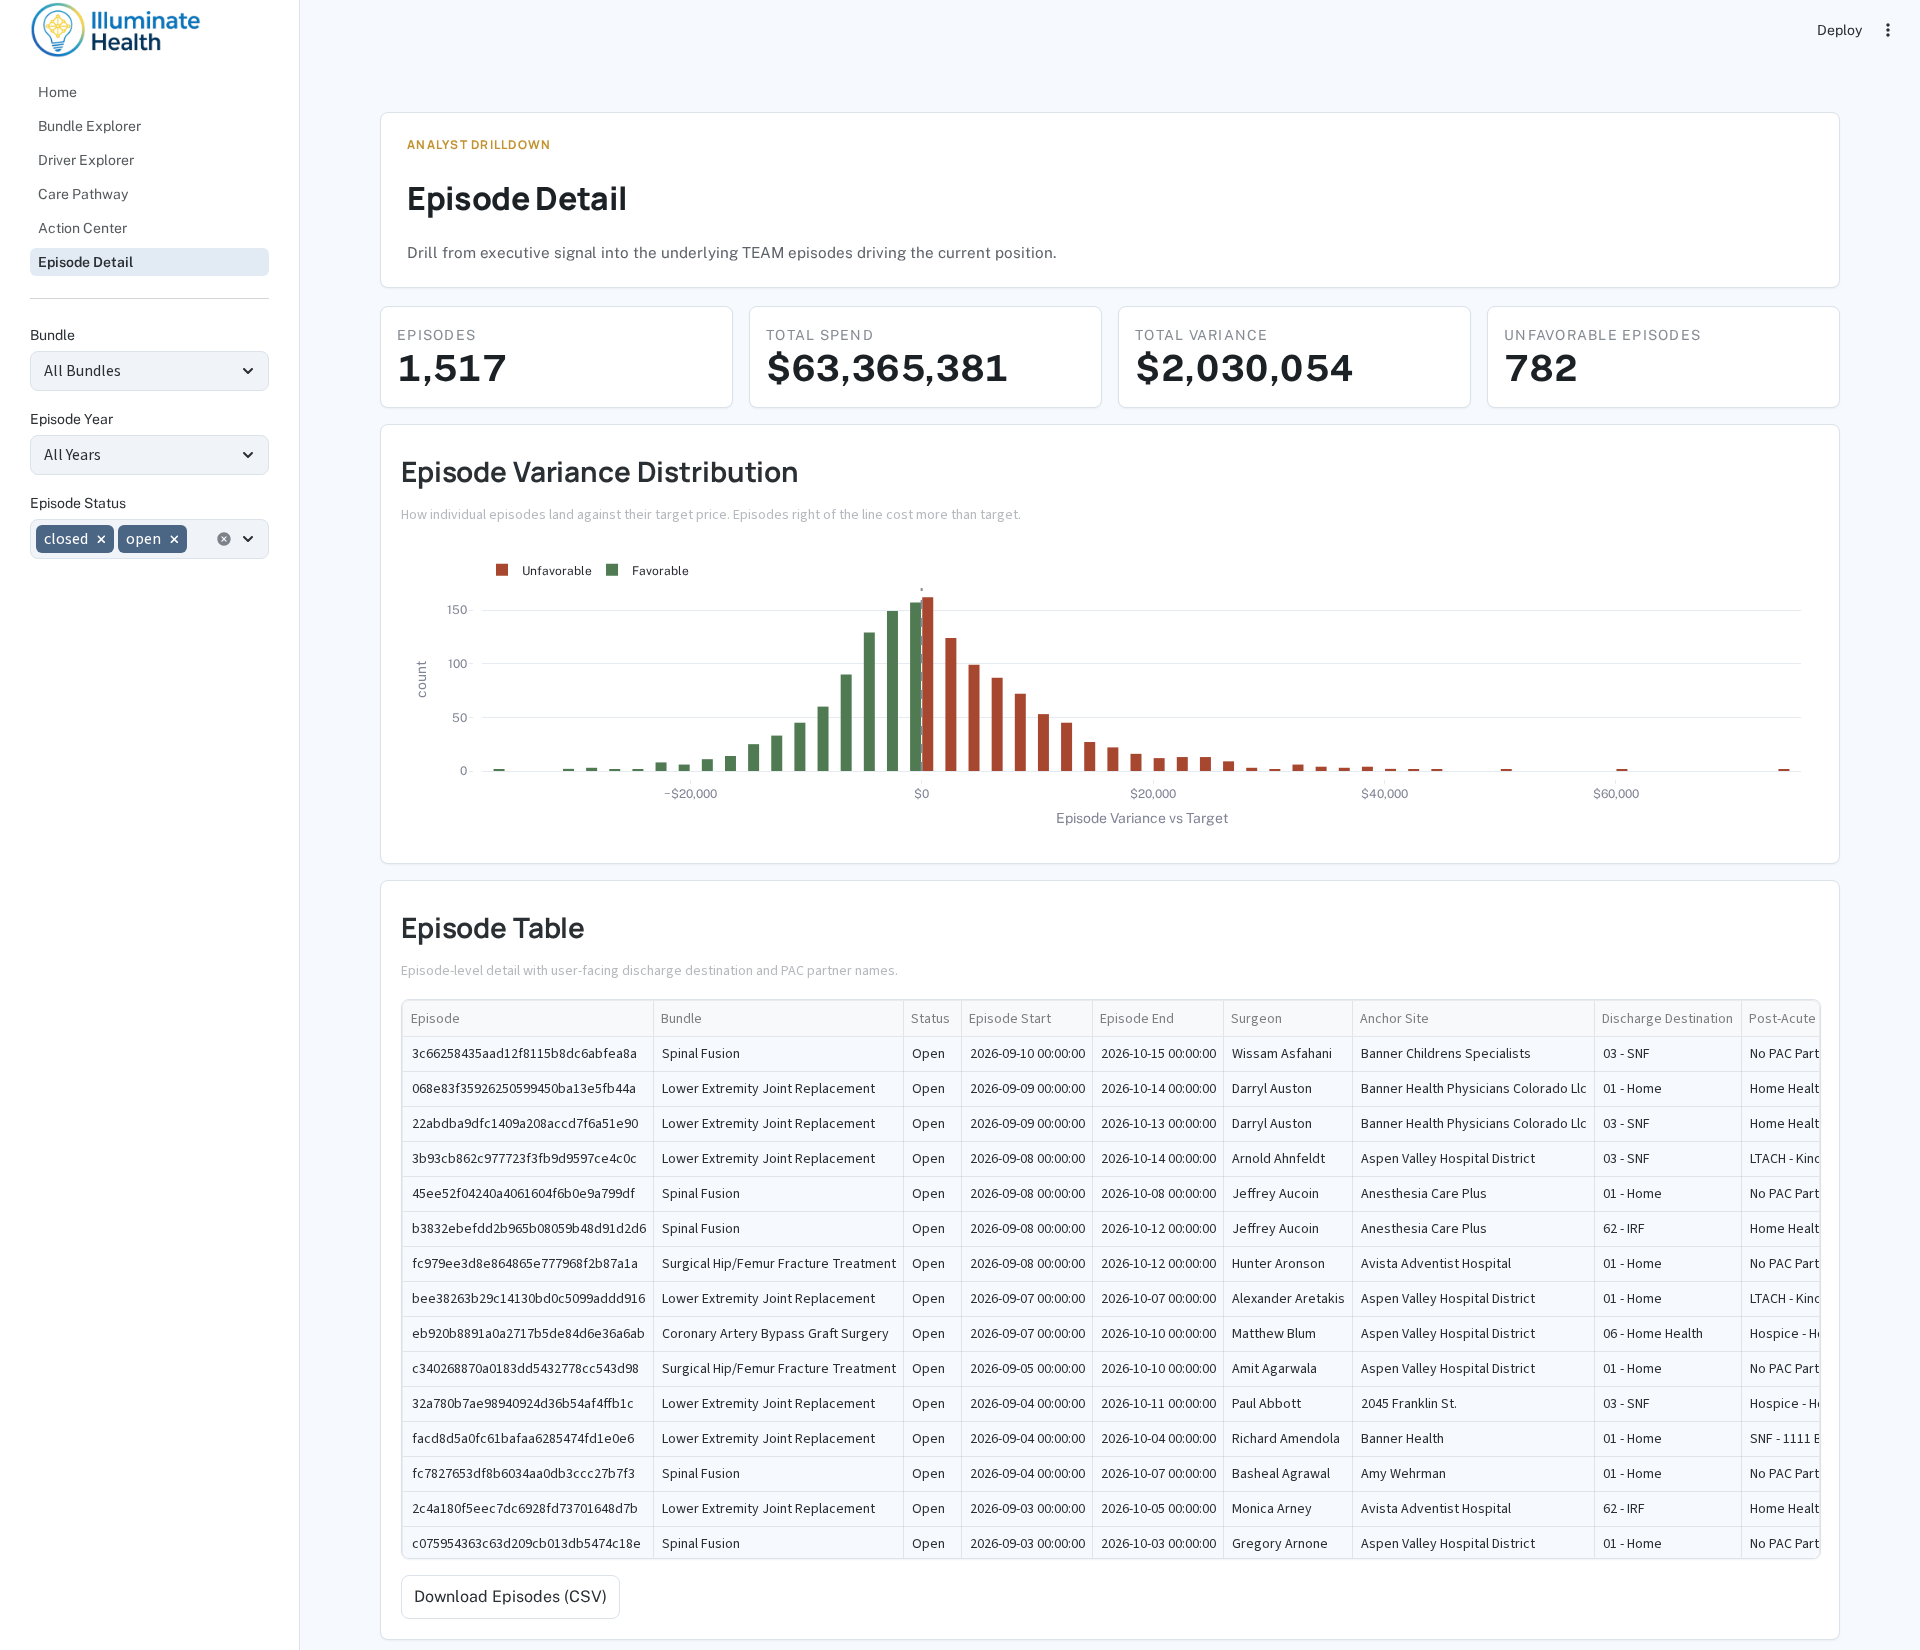
Analyst drill-down: episode variance distribution, filterable episode-level table, and CSV export.
Metrics Leaders Can Review
- Episode count, open episode count, and closed episode count
- Total episode spend and spend-to-snapshot
- Total target price and variance
- Estimated final spend scenarios for open episodes
- Readmission rate and readmission spend
- Post-acute spend per episode
- Favorable episode rate
- Variance by surgeon, site, post-acute partner, discharge disposition, and bundle
Actionable Output
mart_team__opportunity turns analytics into a worklist. It identifies:
- Concentrated unfavorable variance by surgeon, anchor site, or post-acute partner
- Readmission hotspots above bundle baseline
- Open episodes already unfavorable to target before runoff is complete
Each row includes the impacted entity, impact amount, priority rank, summary, and recommended action.